Description
Original Sales Page: https://www.wyckoffanalytics.com/demand/wyckoff-point-and-figure-charting-3-course-bundle/
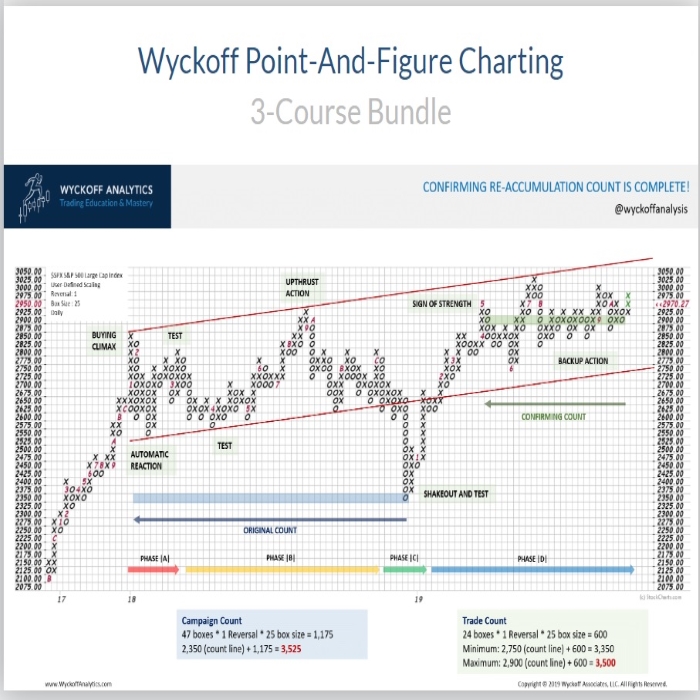
Wyckoff Analytics – Point-And-Figure Charting 3 Course Bundle (Part I + II + III)
This bundle includes the following courses:
✔ P&F Part I: Setting Price Targets Using Wyckoff Point-And-Figure Projections
Legendary trader and educator Richard Wyckoff based his investment decisions primarily on analysis of market structure, supply and demand, and comparative strength. A final, critical component of Wyckoff’s trade selection and management was his unique method of using Point-and-Figure (P&F) charts both to identify realistic price targets and to improve timing of entries and exits. This technique works well for calculating reward-to-risk ratios and helping traders stay with a winning trade through normal corrections.
In Part I of this series, Bruce Fraser and Roman Bogomazov cover the basics of using Point-and-Figure charts to calculate price targets using Wyckoff’s unique horizontal counting approach. Bruce and Roman present the materials as case studies that start with a blank P&F chart and then, as the chart unfolds over time, they show you their step-by-step process for taking and projecting horizontal counts.
✔ P&F Part II: Projecting Point-And-Figure Price Targets Across Multiple Time Frames
Among Richard Wyckoff’s many contributions to technical analysis is his unique method of estimating price targets using his Second Law of “Cause and Effect,” in which the horizontal Point and Figure (P&F) count in any trading range represents the Cause and the subsequent trending price movement the Effect. Like many other phenomena in trading, Wyckoff’s Second Law is fractal, and can be profitably deployed in any time frame. In P&F Part II, Bruce Fraser and Roman Bogomazov provide detailed instructions on how to:
- Create and annotate Wyckoff-style P&F charts
- Correctly identify the count line in a variety of trading range configurations
- Designate P&F phases sequentially and project price targets from each
- Anticipate the resumption of a trend based on confirming counts of re-accumulation and re-distribution trading ranges
- Manage trades once price approaches P&F-based price targets
✔ P&F Part III: Developing a systematic approach to trading using Wyckoff Point-and-Figure Charts
Wyckoff’s Law of Cause and Effect forms the foundation for his exceptional method of estimating price objectives using Point-and-Figure (P&F) charts. The underlying concept is deceptively simple, with the Cause equaling the horizontal P&F count in a trading range, which in turn generates an Effect or price target from the resulting trend. To obtain consistently reliable results with Wyckoff P&F charting, however, traders need a systematic approach, with guidelines that accommodate differences in trading range structures and timeframes.
We provided just such an approach, including some advanced and relatively new refinements, in our prior Point-and-Figure courses, which are among the most popular of all our on-demand courses. Point-and-Figure Part III, was developed in response to many student requests for additional applications of this remarkably versatile tool.